


安装准备
- 树莓派k8s集群
root@pi4-master01:~# kubectl get nodes -o wide
NAME           STATUS   ROLES    AGE     VERSION    INTERNAL-IP    EXTERNAL-IP   OS-IMAGE           KERNEL-VERSION     CONTAINER-RUNTIME
pi4-master01   Ready    master   4d18h   v1.15.10   192.168.5.18   <none>        Ubuntu 20.04 LTS   5.4.0-1011-raspi   docker://18.9.9
pi4-node01     Ready    node     4d17h   v1.15.10   192.168.5.19   <none>        Ubuntu 20.04 LTS   5.4.0-1011-raspi   docker://18.9.9
pi4-node02     Ready    node     4d17h   v1.15.10   192.168.5.20   <none>        Ubuntu 20.04 LTS   5.4.0-1011-raspi   docker://18.9.9
- 树莓派k8s集群已安装helm
root@pi4-master01:~/k8s/cluster-monitoring-0.37.0# helm version
Client: &version.Version{SemVer:"v2.15.0", GitCommit:"c2440264ca6c078a06e088a838b0476d2fc14750", GitTreeState:"clean"}
Server: &version.Version{SemVer:"v2.15.0+unreleased", GitCommit:"9668ad4d90c5e95bd520e58e7387607be6b63bb6", GitTreeState:"dirty"}
- 树莓派k8s集群已安装存储类,并设置为默认存储
root@pi4-master01:~/k8s/cluster-monitoring-0.37.0# kubectl get storageclass
NAME                   PROVISIONER             AGE
local-path (default)   rancher.io/local-path   4d15h
对了,如果你还没有树莓派k8s集群,这里有一篇树莓派 k8s 集群入坑指南可以参考,欢迎入坑。
helm安装kafka集群
这里我们选择用helm方式安装,我们选择的是官方的chart地址:https://github.com/helm/charts/tree/master/incubator/kafka, 这个chart默认在 http://storage.googleapis.com/kubernetes-charts-incubator 上。
root@pi4-master01:~# helm repo add incubator http://storage.googleapis.com/kubernetes-charts-incubator
"incubator" has been added to your repositories
root@pi4-master01:~# helm repo list
NAME     	URL
local    	http://127.0.0.1:8879/charts
stable   	http://mirror.azure.cn/kubernetes/charts/
incubator	http://storage.googleapis.com/kubernetes-charts-incubator
root@k8s-master:~# helm search kafka
NAME                     	CHART VERSION	APP VERSION	DESCRIPTION
incubator/kafka          	0.21.2       	5.0.1      	Apache Kafka is publish-subscribe messaging rethought as ...
stable/kafka-manager     	2.3.1        	1.3.3.22   	A tool for managing Apache Kafka.
incubator/schema-registry	1.2.0        	5.0.1      	Schema Registry provides a serving layer for your metadat...
stable/schema-registry-ui	0.4.2        	v0.9.5     	This is a web tool for the confluentinc/schema-registry i...
incubator/kafka就是我们需要安装的chart。这个chart还以子chart的形式引入了zookeeper的chart,默认情况安装,不仅会安装3个节点的kafka集群,也会安装3个节点的zookeeper集群。
注意:incubator/kafka从版本0.17.0开始,内置的zookeeper版本切换成了zookeeper:3.5.5,这个版本的arm架构镜像目前社区内还没有,自己构建暂时不成功,所以暂时使用版本0.16.4来安装,0.16.4版本用的是google的k8szk,具体镜像是参考k8szk的Dockerfile构建而成,封装版本是3.4.14。
- 使用helm安装kakfka集群命令如下
helm install -n kafka \
incubator/kafka --version 0.16.4 \
--set image=iecedge/cp-kafka-arm64 \
--set imageTag=5.0.1 \
--set zookeeper.image.repository=pi4k8s/k8szk \
--set zookeeper.image.tag=v3.4.14
通过上述命令,将以默认的配置在Kubernetes中部署kafka。默认情况下,chart会安装部署3个kafka Pod和3个 zookeeper Pod。其中3个zookeeper Pod组成zookeeper集群,另外3个kafka Pod依赖该zookeeper集群组成kafka集群。
该chart中涉及的镜像均是x86的,只要把相关的镜像换成arm64v8架构的镜像即可。另外,该chart默认开启了kafka的持久化存储,不指定storageclass的话,将使用k8s的默认存储。因为我们的树莓派k8s集群已经设置了local-path为默认storageclass,所以不需要关闭持久化存储既可正常安装。
- 查看创建的pod
root@pi4-master01:~# kubectl get pod | grep kafka
kafka-0                                          1/1     Running   2          9m55s
kafka-1                                          1/1     Running   0          7m10s
kafka-2                                          1/1     Running   0          4m17s
kafka-zookeeper-0                                1/1     Running   0          9m55s
kafka-zookeeper-1                                1/1     Running   0          9m31s
kafka-zookeeper-2                                1/1     Running   0          7m20s
- 查看创建的svc
root@pi4-master01:~# kubectl get svc|grep kafka
kafka                           ClusterIP   10.102.254.197   <none>         9092/TCP                     94m
kafka-headless                  ClusterIP   None             <none>         9092/TCP                     94m
kafka-zookeeper                 ClusterIP   10.105.26.83     <none>         2181/TCP                     94m
kafka-zookeeper-headless        ClusterIP   None             <none>         2181/TCP,3888/TCP,2888/TCP   94m
- 查看创建的pv,pvc
root@pi4-master01:~# kubectl get pvc,pv | grep kafka
persistentvolumeclaim/datadir-kafka-0                           Bound    pvc-35d461a8-da86-404b-9654-12416ee312e4   1Gi        RWO            local-path     152m

persistentvolumeclaim/datadir-kafka-1                           Bound    pvc-8042ba75-3504-4c55-ad18-0de74badf2bd   1Gi        RWO            local-path     7m59s
persistentvolumeclaim/datadir-kafka-2                           Bound    pvc-bf828ff4-fbf4-4d91-a042-6d6f8b4bf563   1Gi        RWO            local-path     5m6s
persistentvolume/pvc-35d461a8-da86-404b-9654-12416ee312e4   1Gi        RWO            Delete           Bound    default/datadir-kafka-0                           local-path              152m
persistentvolume/pvc-8042ba75-3504-4c55-ad18-0de74badf2bd   1Gi        RWO            Delete           Bound    default/datadir-kafka-1                           local-path              7m56s
persistentvolume/pvc-bf828ff4-fbf4-4d91-a042-6d6f8b4bf563   1Gi        RWO            Delete           Bound    default/datadir-kafka-2                           local-path              5m
验证
验证kafka集群
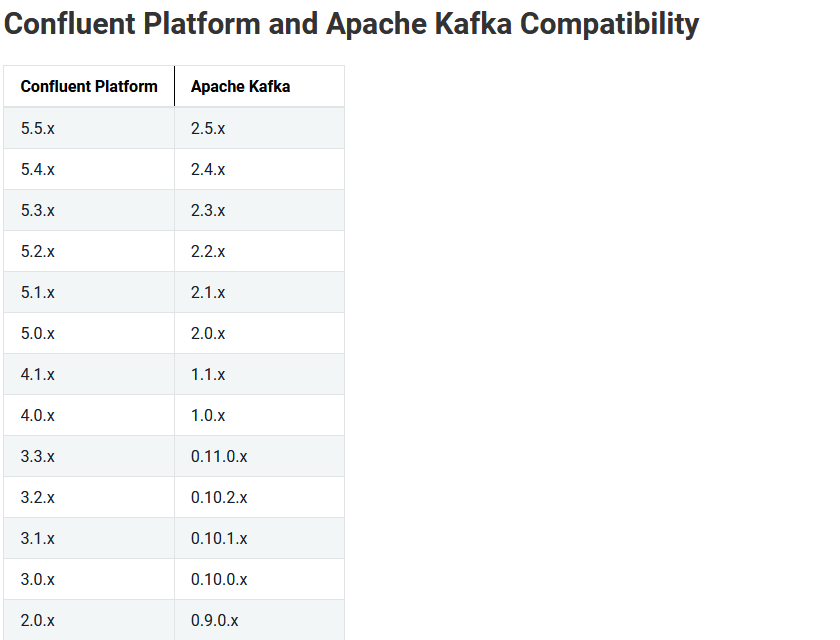
该chart默认使用的kafka镜像是confluentinc/cp-kafka:5.0.1,这个版本对应Apache Kafka的2.0.X系列。Confluent Platform Kafka(简称CP Kafka)提供了一些Apache Kafka没有的高级特性,例如跨数据中心备份、Schema注册中心以及集群监控工具等。
如下是cp-kafka和apache kafka对应关系
- 进入kafka-0容器查看当前kafka版本
root@pi4-master01:~# kubectl exec -it kafka-0 bash
root@kafka-0:/# ls /usr/share/java/kafka | grep kafka
kafka-clients-2.0.1-cp1.jar
kafka-log4j-appender-2.0.1-cp1.jar
kafka-streams-2.0.1-cp1.jar
kafka-streams-examples-2.0.1-cp1.jar
kafka-streams-scala_2.11-2.0.1-cp1.jar
kafka-streams-test-utils-2.0.1-cp1.jar
kafka-tools-2.0.1-cp1.jar
kafka.jar
kafka_2.11-2.0.1-cp1-javadoc.jar
kafka_2.11-2.0.1-cp1-scaladoc.jar
kafka_2.11-2.0.1-cp1-sources.jar
kafka_2.11-2.0.1-cp1-test-sources.jar
kafka_2.11-2.0.1-cp1-test.jar
kafka_2.11-2.0.1-cp1.jar
可以看到对应apache kafka的版本号是2.11-2.0.1,前面2.11是Scala编译器的版本,Kafka的服务器端代码是使用Scala语言开发的,后边2.0.1是Kafka的版本。
- 进入kafka-0容器创建一个Topic test1
root@pi4-master01:~# kubectl exec -it kafka-0 bash
root@kafka-0:/# kafka-topics --zookeeper kafka-zookeeper:2181 --topic test1 --create --partitions 3 --replication-factor 3
Created topic "test1".
- 进入kafka-1容器查看当前Topic
root@pi4-master01:~# kubectl exec -it kafka-1 bash
root@kafka-1:/# kafka-topics --zookeeper kafka-zookeeper:2181 --list
test1
- 进入kafka-0容器创建一个生产者向Topic test1并发消息
root@pi4-master01:~# kubectl exec -it kafka-0 bash
root@kafka-0:/#  kafka-console-producer --broker-list kafka:9092 -topic test1
>hello
>world
- 同时进入kafka-1容器创建一个消费者监听Topic test1
root@pi4-master01:~# kubectl exec -it kafka-0 bash
 root@kafka-1:/# kafka-console-consumer --bootstrap-server kafka:9092 -topic test1
hello
world
验证zookeeper集群
root@pi4-master01:~# kubectl exec -it kafka-zookeeper-0 zkServer.sh status
ZooKeeper JMX enabled by default
ZooKeeper remote JMX Port set to 1099
ZooKeeper remote JMX authenticate set to false
ZooKeeper remote JMX ssl set to false
ZooKeeper remote JMX log4j set to true
Using config: /usr/bin/../etc/zookeeper/zoo.cfg
Mode: follower
root@pi4-master01:~# kubectl exec -it kafka-zookeeper-1 zkServer.sh status
ZooKeeper JMX enabled by default
ZooKeeper remote JMX Port set to 1099
ZooKeeper remote JMX authenticate set to false
ZooKeeper remote JMX ssl set to false
ZooKeeper remote JMX log4j set to true
Using config: /usr/bin/../etc/zookeeper/zoo.cfg
Mode: leader
root@pi4-master01:~# kubectl exec -it kafka-zookeeper-2 zkServer.sh status
ZooKeeper JMX enabled by default
ZooKeeper remote JMX Port set to 1099
ZooKeeper remote JMX authenticate set to false
ZooKeeper remote JMX ssl set to false
ZooKeeper remote JMX log4j set to true
Using config: /usr/bin/../etc/zookeeper/zoo.cfg
Mode: follower
可以看到3个pod中会有一个leader,2个follower,集群状态OK。
其它配置
基于helm在树莓派k8s集群安装kafka集群还是很方便的,只需要使用arm64v8架构的镜像即可。但是如果想要部署的kafka集群更具有个性,还是很有必要研究一下该chart的其它配置项,这些配置项我们可以通过helm inspect命令来查看
root@pi4-master01:~# helm inspect values incubator/kafka --version 0.16.4
# ------------------------------------------------------------------------------
# Kafka:
# ------------------------------------------------------------------------------

## The StatefulSet installs 3 pods by default
replicas: 3

## The kafka image repository
image: "confluentinc/cp-kafka"

## The kafka image tag
imageTag: "5.0.1"  # Confluent image for Kafka 2.0.0

## Specify a imagePullPolicy
## ref: http://kubernetes.io/docs/user-guide/images/#pre-pulling-images
imagePullPolicy: "IfNotPresent"

## Configure resource requests and limits
## ref: http://kubernetes.io/docs/user-guide/compute-resources/
resources: {}
  # limits:
  #   cpu: 200m
  #   memory: 1536Mi
  # requests:
  #   cpu: 100m
  #   memory: 1024Mi
kafkaHeapOptions: "-Xmx1G -Xms1G"

## Optional Container Security context
securityContext: {}

## The StatefulSet Update Strategy which Kafka will use when changes are applied.
## ref: https://kubernetes.io/docs/concepts/workloads/controllers/statefulset/#update-strategies
updateStrategy:
  type: "OnDelete"

## Start and stop pods in Parallel or OrderedReady (one-by-one.)  Note - Can not change after first release.
## ref: https://kubernetes.io/docs/tutorials/stateful-application/basic-stateful-set/#pod-management-policy
podManagementPolicy: OrderedReady

## Useful if using any custom authorizer
## Pass in some secrets to use (if required)
# secrets:
# - name: myKafkaSecret
#   keys:
#     - username
#     - password
#   # mountPath: /opt/kafka/secret
# - name: myZkSecret
#   keys:
#     - user
#     - pass
#   mountPath: /opt/zookeeper/secret


## The subpath within the Kafka container's PV where logs will be stored.
## This is combined with `persistence.mountPath`, to create, by default: /opt/kafka/data/logs
logSubPath: "logs"

## Use an alternate scheduler, e.g. "stork".
## ref: https://kubernetes.io/docs/tasks/administer-cluster/configure-multiple-schedulers/
##
# schedulerName:

## Use an alternate serviceAccount
## Useful when using images in custom repositories
# serviceAccountName:

## Pod scheduling preferences (by default keep pods within a release on separate nodes).
## ref: https://kubernetes.io/docs/concepts/configuration/assign-pod-node/#affinity-and-anti-affinity
## By default we don't set affinity
affinity: {}
## Alternatively, this typical example defines:
## antiAffinity (to keep Kafka pods on separate pods)
## and affinity (to encourage Kafka pods to be collocated with Zookeeper pods)
# affinity:
#   podAntiAffinity:
#     requiredDuringSchedulingIgnoredDuringExecution:
#     - labelSelector:
#         matchExpressions:
#         - key: app
#           operator: In
#           values:
#           - kafka
#       topologyKey: "kubernetes.io/hostname"
#   podAffinity:
#     preferredDuringSchedulingIgnoredDuringExecution:
#      - weight: 50
#        podAffinityTerm:
#          labelSelector:
#            matchExpressions:
#            - key: app
#              operator: In
#              values:
#                - zookeeper
#          topologyKey: "kubernetes.io/hostname"

## Node labels for pod assignment
## ref: https://kubernetes.io/docs/concepts/configuration/assign-pod-node/#nodeselector
nodeSelector: {}

## Readiness probe config.
## ref: https://kubernetes.io/docs/tasks/configure-pod-container/configure-liveness-readiness-probes/
##
readinessProbe:
  initialDelaySeconds: 30
  periodSeconds: 10
  timeoutSeconds: 5
  successThreshold: 1
  failureThreshold: 3

## Period to wait for broker graceful shutdown (sigterm) before pod is killed (sigkill)
## ref: https://kubernetes-v1-4.github.io/docs/user-guide/production-pods/#lifecycle-hooks-and-termination-notice
## ref: https://kafka.apache.org/10/documentation.html#brokerconfigs controlled.shutdown.*
terminationGracePeriodSeconds: 60

# Tolerations for nodes that have taints on them.
# Useful if you want to dedicate nodes to just run kafka
# https://kubernetes.io/docs/concepts/configuration/taint-and-toleration/
tolerations: []
# tolerations:
# - key: "key"
#   operator: "Equal"
#   value: "value"
#   effect: "NoSchedule"

## Headless service.
##
headless:
  # annotations:
  # targetPort:
  port: 9092

## External access.
##
external:
  enabled: false
  # type can be either NodePort or LoadBalancer
  type: NodePort
  # annotations:
  #  service.beta.kubernetes.io/openstack-internal-load-balancer: "true"
  dns:
    useInternal: false
    useExternal: true
  # If using external service type LoadBalancer and external dns, set distinct to true below.
  # This creates an A record for each statefulset pod/broker. You should then map the
  # A record of the broker to the EXTERNAL IP given by the LoadBalancer in your DNS server.
  distinct: false
  servicePort: 19092
  firstListenerPort: 31090
  domain: cluster.local
  loadBalancerIP: []
  init:
    image: "lwolf/kubectl_deployer"
    imageTag: "0.4"
    imagePullPolicy: "IfNotPresent"

# Annotation to be added to Kafka pods
podAnnotations: {}

# Labels to be added to Kafka pods
podLabels: {}
  # service: broker
  # team: developers


## Configuration Overrides. Specify any Kafka settings you would like set on the StatefulSet
## here in map format, as defined in the official docs.
## ref: https://kafka.apache.org/documentation/#brokerconfigs
##
configurationOverrides:
  "confluent.support.metrics.enable": false  # Disables confluent metric submission
  # "auto.leader.rebalance.enable": true
  # "auto.create.topics.enable": true
  # "controlled.shutdown.enable": true
  # "controlled.shutdown.max.retries": 100

  ## Options required for external access via NodePort
  ## ref:
  ## - http://kafka.apache.org/documentation/#security_configbroker
  ## - https://cwiki.apache.org/confluence/display/KAFKA/KIP-103%3A+Separation+of+Internal+and+External+traffic
  ##
  ## Setting "advertised.listeners" here appends to "PLAINTEXT://${POD_IP}:9092,", ensure you update the domain
  ## If external service type is Nodeport:
  # "advertised.listeners": |-
  #   EXTERNAL://kafka.cluster.local:$((31090 + ${KAFKA_BROKER_ID}))
  ## If external service type is LoadBalancer and distinct is true:
  # "advertised.listeners": |-
  #   EXTERNAL://kafka-$((${KAFKA_BROKER_ID})).cluster.local:19092
  ## If external service type is LoadBalancer and distinct is false:
  # "advertised.listeners": |-
  #   EXTERNAL://${LOAD_BALANCER_IP}:31090
  ## Uncomment to define the EXTERNAL Listener protocol
  # "listener.security.protocol.map": |-
  #   PLAINTEXT:PLAINTEXT,EXTERNAL:PLAINTEXT

## set extra ENVs
#   key: "value"
envOverrides: {}


## A collection of additional ports to expose on brokers (formatted as normal containerPort yaml)
# Useful when the image exposes metrics (like prometheus, etc.) through a javaagent instead of a sidecar
additionalPorts: {}

## Persistence configuration. Specify if and how to persist data to a persistent volume.
##
persistence:
  enabled: true

  ## The size of the PersistentVolume to allocate to each Kafka Pod in the StatefulSet. For
  ## production servers this number should likely be much larger.
  ##
  size: "1Gi"

  ## The location within the Kafka container where the PV will mount its storage and Kafka will
  ## store its logs.
  ##
  mountPath: "/opt/kafka/data"

  ## Kafka data Persistent Volume Storage Class
  ## If defined, storageClassName: <storageClass>
  ## If set to "-", storageClassName: "", which disables dynamic provisioning
  ## If undefined (the default) or set to null, no storageClassName spec is
  ##   set, choosing the default provisioner.  (gp2 on AWS, standard on
  ##   GKE, AWS & OpenStack)
  ##
  # storageClass:

jmx:
  ## Rules to apply to the Prometheus JMX Exporter.  Note while lots of stats have been cleaned and exposed,
  ## there are still more stats to clean up and expose, others will never get exposed.  They keep lots of duplicates
  ## that can be derived easily.  The configMap in this chart cleans up the metrics it exposes to be in a Prometheus
  ## format, eg topic, broker are labels and not part of metric name. Improvements are gladly accepted and encouraged.
  configMap:

    ## Allows disabling the default configmap, note a configMap is needed
    enabled: true

    ## Allows setting values to generate confimap
    ## To allow all metrics through (warning its crazy excessive) comment out below `overrideConfig` and set
    ## `whitelistObjectNames: []`
    overrideConfig: {}
      # jmxUrl: service:jmx:rmi:///jndi/rmi://127.0.0.1:5555/jmxrmi
      # lowercaseOutputName: true
      # lowercaseOutputLabelNames: true
      # ssl: false
      # rules:
      # - pattern: ".*"

    ## If you would like to supply your own ConfigMap for JMX metrics, supply the name of that
    ## ConfigMap as an `overrideName` here.
    overrideName: ""

  ## Port the jmx metrics are exposed in native jmx format, not in Prometheus format
  port: 5555

  ## JMX Whitelist Objects, can be set to control which JMX metrics are exposed.  Only whitelisted
  ## values will be exposed via JMX Exporter.  They must also be exposed via Rules.  To expose all metrics
  ## (warning its crazy excessive and they aren't formatted in a prometheus style) (1) `whitelistObjectNames: []`
  ## (2) commented out above `overrideConfig`.
  whitelistObjectNames:  # []
  - kafka.controller:*
  - kafka.server:*
  - java.lang:*
  - kafka.network:*
  - kafka.log:*

## Prometheus Exporters / Metrics
##
prometheus:
  ## Prometheus JMX Exporter: exposes the majority of Kafkas metrics
  jmx:
    enabled: false

    ## The image to use for the metrics collector
    image: solsson/kafka-prometheus-jmx-exporter@sha256

    ## The image tag to use for the metrics collector
    imageTag: a23062396cd5af1acdf76512632c20ea6be76885dfc20cd9ff40fb23846557e8

    ## Interval at which Prometheus scrapes metrics, note: only used by Prometheus Operator
    interval: 10s

    ## Timeout at which Prometheus timeouts scrape run, note: only used by Prometheus Operator
    scrapeTimeout: 10s

    ## Port jmx-exporter exposes Prometheus format metrics to scrape
    port: 5556

    resources: {}
      # limits:
      #   cpu: 200m
      #   memory: 1Gi
      # requests:
      #   cpu: 100m
      #   memory: 100Mi

  ## Prometheus Kafka Exporter: exposes complimentary metrics to JMX Exporter
  kafka:
    enabled: false

    ## The image to use for the metrics collector
    image: danielqsj/kafka-exporter

    ## The image tag to use for the metrics collector
    imageTag: v1.2.0

    ## Interval at which Prometheus scrapes metrics, note: only used by Prometheus Operator
    interval: 10s

    ## Timeout at which Prometheus timeouts scrape run, note: only used by Prometheus Operator
    scrapeTimeout: 10s

    ## Port kafka-exporter exposes for Prometheus to scrape metrics
    port: 9308

    ## Resource limits
    resources: {}
#      limits:
#        cpu: 200m
#        memory: 1Gi
#      requests:
#        cpu: 100m
#        memory: 100Mi

    # Tolerations for nodes that have taints on them.
    # Useful if you want to dedicate nodes to just run kafka-exporter
    # https://kubernetes.io/docs/concepts/configuration/taint-and-toleration/
    tolerations: []
    # tolerations:
    # - key: "key"
    #   operator: "Equal"
    #   value: "value"
    #   effect: "NoSchedule"

    ## Pod scheduling preferences (by default keep pods within a release on separate nodes).
    ## ref: https://kubernetes.io/docs/concepts/configuration/assign-pod-node/#affinity-and-anti-affinity
    ## By default we don't set affinity
    affinity: {}
    ## Alternatively, this typical example defines:
    ## affinity (to encourage Kafka Exporter pods to be collocated with Kafka pods)
    # affinity:
    #   podAffinity:
    #     preferredDuringSchedulingIgnoredDuringExecution:
    #      - weight: 50
    #        podAffinityTerm:
    #          labelSelector:
    #            matchExpressions:
    #            - key: app
    #              operator: In
    #              values:
    #                - kafka
    #          topologyKey: "kubernetes.io/hostname"

    ## Node labels for pod assignment
    ## ref: https://kubernetes.io/docs/concepts/configuration/assign-pod-node/#nodeselector
    nodeSelector: {}

  operator:
    ## Are you using Prometheus Operator?
    enabled: false

    serviceMonitor:
      # Namespace Prometheus is installed in
      namespace: monitoring

      ## Defaults to whats used if you follow CoreOS [Prometheus Install Instructions](https://github.com/coreos/prometheus-operator/tree/master/helm#tldr)
      ## [Prometheus Selector Label](https://github.com/coreos/prometheus-operator/blob/master/helm/prometheus/templates/prometheus.yaml#L65)
      ## [Kube Prometheus Selector Label](https://github.com/coreos/prometheus-operator/blob/master/helm/kube-prometheus/values.yaml#L298)
      selector:
        prometheus: kube-prometheus

## Kafka Config job configuration
##
configJob:
  ## Specify the number of retries before considering kafka-config job as failed.
  ## https://kubernetes.io/docs/concepts/workloads/controllers/jobs-run-to-completion/#pod-backoff-failure-policy
  backoffLimit: 6

## Topic creation and configuration.
## The job will be run on a deployment only when the config has been changed.
## - If 'partitions' and 'replicationFactor' are specified we create the topic (with --if-not-exists.)
## - If 'partitions', 'replicationFactor' and 'reassignPartitions' are specified we reassign the partitions to
## increase the replication factor of an existing topic.
## - If 'partitions' is specified we 'alter' the number of partitions. This will
## silently and safely fail if the new setting isn’t strictly larger than the old (i.e. a NOOP.) Do be aware of the
## implications for keyed topics (ref: https://docs.confluent.io/current/kafka/post-deployment.html#admin-operations)
## - If 'defaultConfig' is specified it's deleted from the topic configuration. If it isn't present,
## it will silently and safely fail.
## - If 'config' is specified it's added to the topic configuration.
##
## Note: To increase the 'replicationFactor' of a topic, 'reassignPartitions' must be set to true (see above).
##
topics: []
  # - name: myExistingTopicConfig
  #   config: "cleanup.policy=compact,delete.retention.ms=604800000"
  # - name: myExistingTopicReassignPartitions
  #   partitions: 8
  #   replicationFactor: 5
  #   reassignPartitions: true
  # - name: myExistingTopicPartitions
  #   partitions: 8
  # - name: myNewTopicWithConfig
  #   partitions: 8
  #   replicationFactor: 3
  #   defaultConfig: "segment.bytes,segment.ms"
  #   config: "cleanup.policy=compact,delete.retention.ms=604800000"
  # - name: myAclTopicPartitions
  #   partitions: 8
  #   acls:
  #     - user: read
  #       operations: [ Read ]
  #     - user: read_and_write
  #       operations:
  #         - Read
  #         - Write
  #     - user: all
  #       operations: [ All ]

# ------------------------------------------------------------------------------
# Zookeeper:
# ------------------------------------------------------------------------------

zookeeper:
  ## If true, install the Zookeeper chart alongside Kafka
  ## ref: https://github.com/kubernetes/charts/tree/master/incubator/zookeeper
  enabled: true

  ## Configure Zookeeper resource requests and limits
  ## ref: http://kubernetes.io/docs/user-guide/compute-resources/
  resources: ~

  ## Environmental variables to set in Zookeeper
  env:
    ## The JVM heap size to allocate to Zookeeper
    ZK_HEAP_SIZE: "1G"

  persistence:
    enabled: false
    ## The amount of PV storage allocated to each Zookeeper pod in the statefulset
    # size: "2Gi"

  ## Specify a Zookeeper imagePullPolicy
  ## ref: http://kubernetes.io/docs/user-guide/images/#pre-pulling-images
  image:
    PullPolicy: "IfNotPresent"

  ## If the Zookeeper Chart is disabled a URL and port are required to connect
  url: ""
  port: 2181

  ## Pod scheduling preferences (by default keep pods within a release on separate nodes).
  ## ref: https://kubernetes.io/docs/concepts/configuration/assign-pod-node/#affinity-and-anti-affinity
  ## By default we don't set affinity:
  affinity: {}  # Criteria by which pod label-values influence scheduling for zookeeper pods.
  # podAntiAffinity:
  #   requiredDuringSchedulingIgnoredDuringExecution:
  #     - topologyKey: "kubernetes.io/hostname"
  #       labelSelector:
  #         matchLabels:
  #           release: zookeeper
显然,配置项很丰富,从jvm参数设置、是否开启监控、是否对k8s集群外部内开启服务都能支持。
开启监控
开启监控前,需要在集群部署prometheus,否则不会有效果。可以参考树莓派k8s集群安装监控prometheus进行部署。
这个chart中kafka的监控,有两种,分别是jmx和kafka两种类型,这里我们只开启kafka类型监控,需要设置prometheus.kafka.enabled为true,且prometheus.kafka.image和prometheus.kafka.imageTag设置为支持arm64v8架构的镜像监控才能使用,这里选择的镜像是iecedge/kafka-exporter_arm64:v1.2.0。
此外,还需要设置prometheus.operator.enabled为true,才能监控到kafka指标。
使用helm安装开启监控的kafka集群命令如下
helm install -n kafka \
incubator/kafka --version 0.16.4 \
--set image=iecedge/cp-kafka-arm64 \
--set imageTag=5.0.1 \
--set prometheus.kafka.enabled=true \
--set prometheus.kafka.image=iecedge/kafka-exporter_arm64 \
--set prometheus.kafka.imageTag=v1.2.0 \
--set prometheus.operator.enabled=true \
--set zookeeper.image.repository=pi4k8s/k8szk \
--set zookeeper.image.tag=v3.4.14
确认安装状态
root@pi4-master01:~# kubectl get pod | grep kafka
kafka-0                                          0/1     Running   0          65s
kafka-exporter-66f7ddcf5d-phdcp                  0/1     Error     3          76s
kafka-zookeeper-0                                1/1     Running   0          76s
kafka-zookeeper-1                                1/1     Running   0          47s
kafka-zookeeper-2                                0/1     Running   0          18s
root@pi4-master01:~# kubectl get pod | grep kafka
kafka-0                                          1/1     Running   1          4m29s
kafka-1                                          1/1     Running   0          3m6s
kafka-2                                          1/1     Running   0          2m32s
kafka-exporter-66f7ddcf5d-phdcp                  1/1     Running   4          4m40s
kafka-zookeeper-0                                1/1     Running   0          4m40s
kafka-zookeeper-1                                1/1     Running   0          4m11s
kafka-zookeeper-2                                1/1     Running   0          3m42s
root@pi4-master01:~# kubectl get svc|grep kafka
kafka                           ClusterIP   10.103.216.68    <none>         9092/TCP                     4m55s
kafka-exporter                  ClusterIP   10.97.79.253     <none>         9308/TCP                     4m55s
kafka-headless                  ClusterIP   None             <none>         9092/TCP                     4m56s
kafka-zookeeper                 ClusterIP   10.105.120.146   <none>         2181/TCP                     4m55s
kafka-zookeeper-headless        ClusterIP   None             <none>         2181/TCP,3888/TCP,2888/TCP   4m56s
root@pi4-master01:~#  kubectl get servicemonitor --all-namespaces |grep kafka
monitoring   kafka-exporter            5m14s
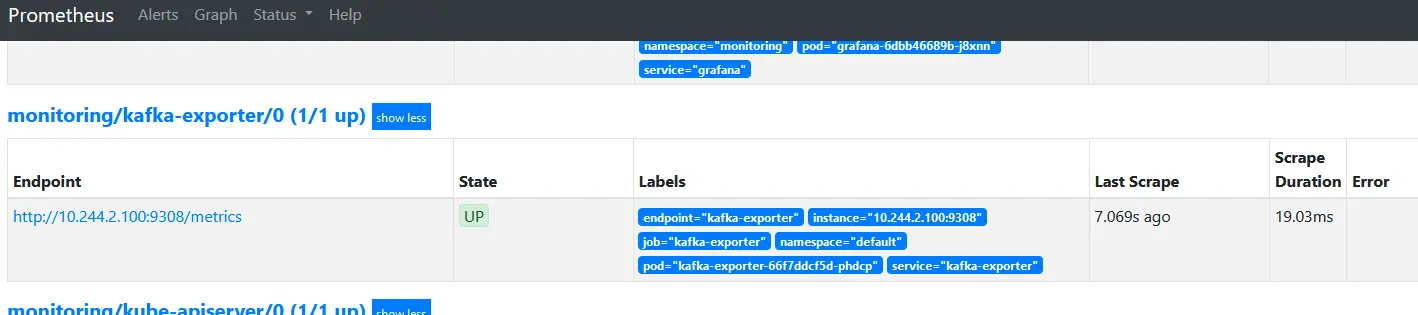
在prometheus查看exporter是否生效
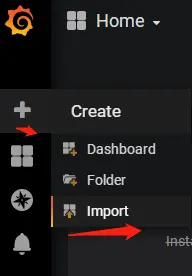
生效后在grafana系统配置kafka监控面板
- kafka监控面板 :https://grafana.com/grafana/dashboards/12460
部署步骤如下:
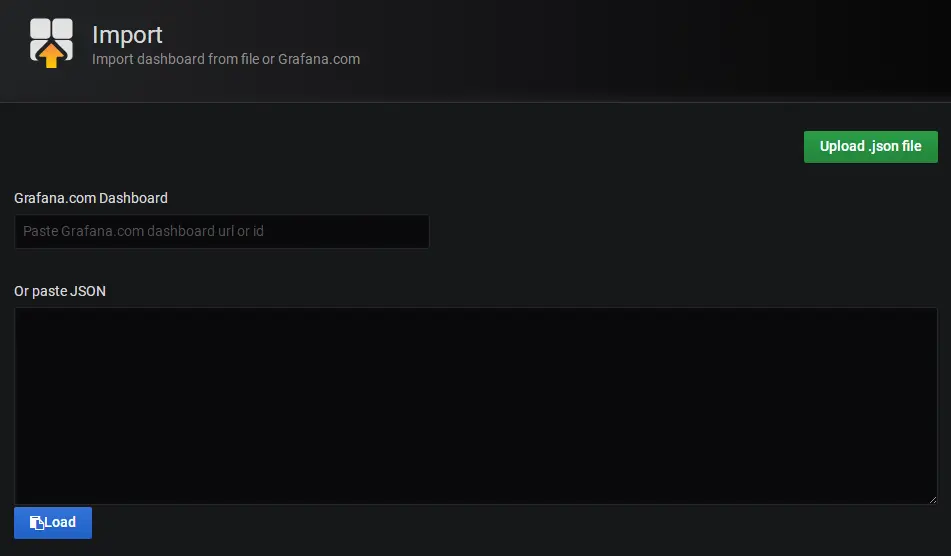
点"Upload .json file"按钮,选择已经下载好的kafka监控面板文件 ,进入面板设置界面如下
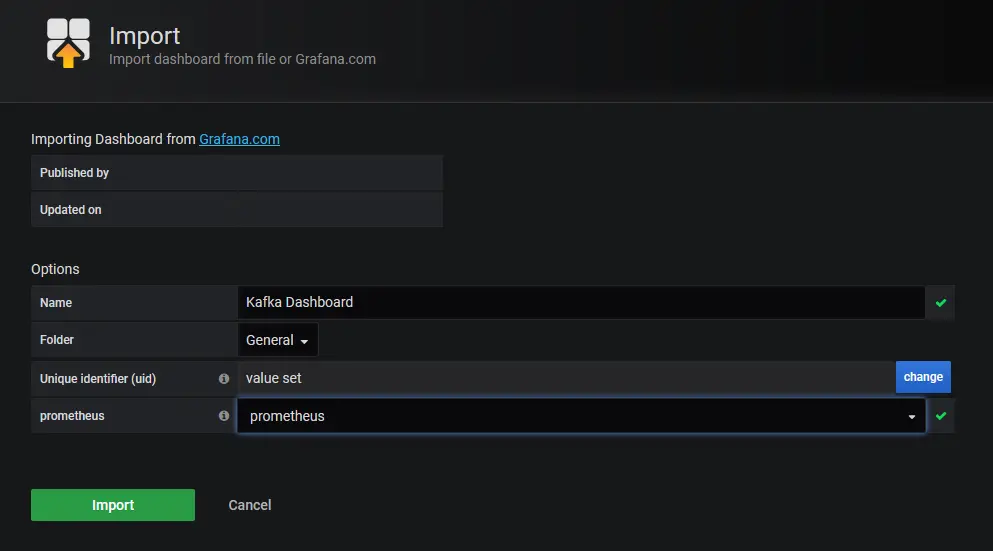
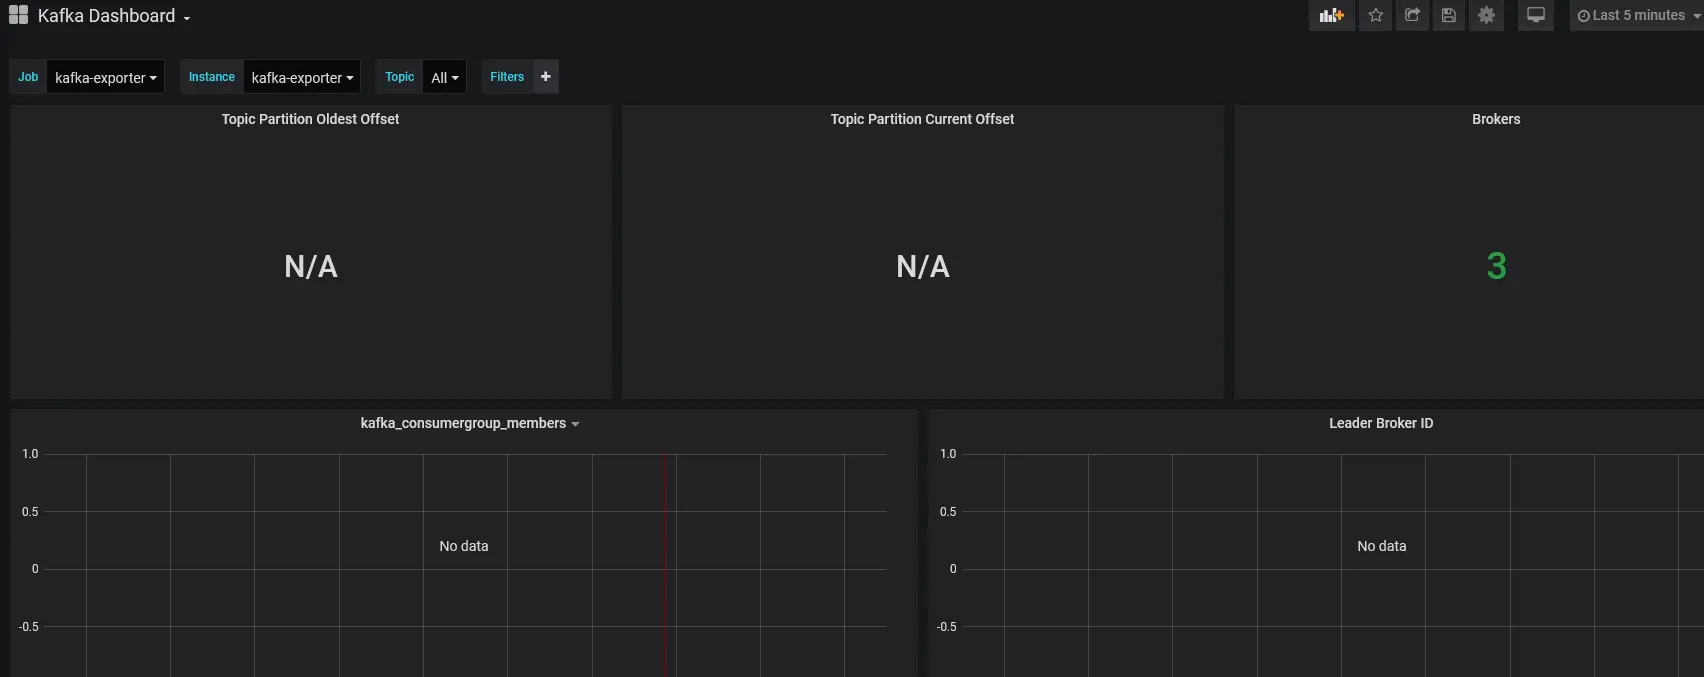
设置好相应参数后,点"Import"按钮,继续导入,引导入kafka监控页面如下
总结
本实践简单介绍了如何使用chart在树莓派k8s集群用helm部署kafka并配置对于kafka的监控,读者可以基于自己的需要自行调整kafka参数以便适用更多场景。
参考:


评论区